Questão 21
UNESP 2022
(UNESP - 2022 - 1ª fase - DIA 1)
Examine os gráficos e leia o texto para responder às questões de 21 a 27.
Educated Americans live longer, as others die younger
Catching up, falling behind
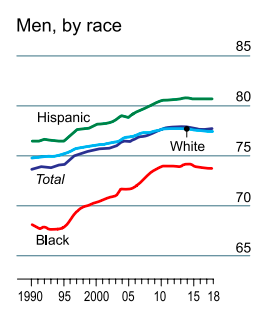
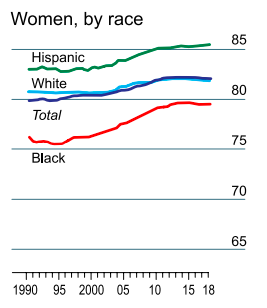
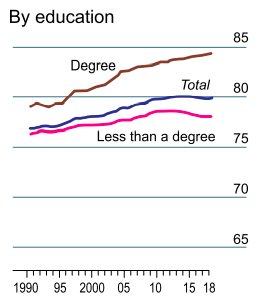
United States, average life expectancy at age 25
(Anne Case and Angus Deaton. “Life expectancy in adulthood is falling for those without a BA degree, but as educational gaps have widened, racial gaps have narrowed”. PNAS, 2021. Adaptado.)
A 25-year-old American with a university degree can expect to live almost a decade longer than a contemporary who dropped out of high school. Although researchers have long known that the rich live longer than the poor, this education gap is less well documented — and is especially marked in rich countries. And whereas the average American’s expected span has been flat in recent years — and, strikingly, even fell between 2015 and 2017 — that of the one-third with a bachelor’s degree has continued to lengthen.
This disparity in life expectancy is growing, according to new research published in the Proceedings of the National Academy of Sciences. Using data from nearly 50m death certificates filed between 1990 and 2018, Anne Case and Angus Deaton of Princeton University analysed differences in life expectancy by sex, race, ethnicity and education. They found that the lifespans of those with and without a bachelor’s degree started to diverge in the 1990s and 2000s. This gap grew even wider in the 2010s as the life expectancy of degree-holders continued to rise while that of other Americans got shorter.
What is the link between schooling and longevity? Some argue that better-educated people develop healthier lifestyles: each additional year of study reduces the chances of being a smoker and of being overweight. The better-educated earn more, which in turn is associated with greater health. Ms Case and Mr Deaton argue that changes in labour markets, including the rise of automation and increased demand for highly-educated workers, coupled with the rising costs of employer-provided health care, have depressed the supply of well-paid jobs for those without a degree. This may be contributing to higher rates of alcohol and drug use, suicide and other “deaths of despair”.
(www.economist.com,17.03.2021. Adaptado.)
The research the text and the graph are based on, concluded that
hispanic women lived less than white men in 1990.
both men and women with a degree are expected to live longer than those who don’t.
life expectancy among black men has been stable between 1990 and 2000.
men with a degree live longer than women with a degree.
black women have the lowest life expectancy when compared to all men race groups.
Gabarito:
both men and women with a degree are expected to live longer than those who don’t.
Resolução:
a) hispanic women lived less than white men in 1990. (Mulheres hispânicas viveram menos que os homens brancos em 1990)
Comentário: incorreta. Os gráficos mostram que as mulheres hispânicas viveram mais que os homens brancos em 1990.
b) both men and women with a degree are expected to live longer than those who don’t. (É esperado que ambos homens e mulheres com um diploma vivam mais que aqueles que não a tem.)
Comentário: correta. Tanto o terceiro gráfico quanto o texto ("A 25-year-old American with a university degree can expect to live almost a decade longer than a contemporary who dropped out of high school") comprovam que a expectativa de vida de alguém com um diploma é maior do que a de alguém que não o possui.
c) life expectancy among black men has been stable between 1990 and 2000. (A expectativa de vida entre os homens negros esteve estável entre 1990 e 2000.)
Comentário: incorreta. É possível perceber pelo gráfico que a expectativa de vida dos homens negros caiu no início dos anos 1990 e, depois, aumentou consideravelmente.
d) men with a degree live longer than women with a degree. (Homens com um diploma vivem mais que mulheres com um diploma.)
Comentário: incorreta. Não há, no texto ou nos gráficos, menções às diferenças de expectativa de vida entre homens e mulheres com diploma.
e) black women have the lowest life expectancy when compared to all men race groups. (Mulheres negras têm a menor expectativa de vida quando comparadas a todos os grupos raciais dos homens.)
Comentário: incorreta. Através dos gráficos é possível perceber que a expectativa de vida de homens negros e brancos é menor do que a expectativa de vida das mulheres negras.